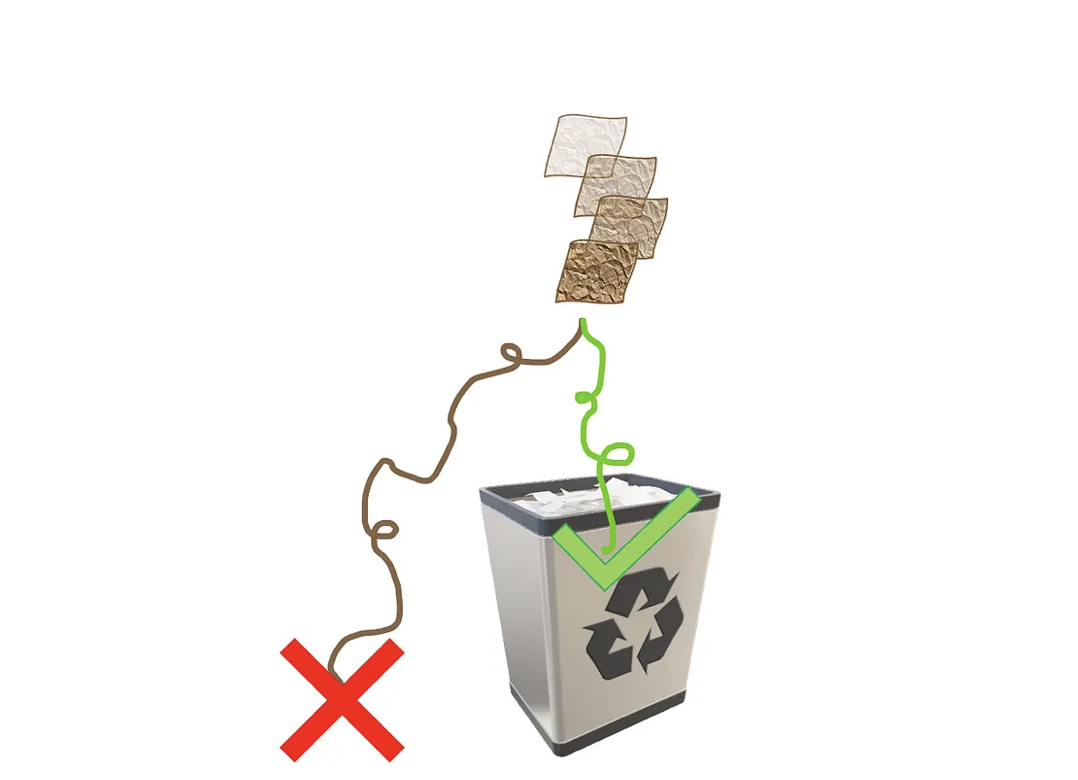
Have you ever tried to throw a badly balled-up candy wrapper in a trash bin just to miss it and feel like trash yourself? Even if you drop it exactly above the bin, it is quite likely the crumpled plastic will swirl and land beside it. A closer look reveals that, as you let go of it, the plastic sheet pushes the air under it as it falls and the air flows by the sheet’s ridges and wrinkles, making it rotate and move sideways. Even the tiniest air current or the slightest extra impulse by your hand may change the landing place significantly. This is a perhaps familiar example of a very complex process that involves turbulence and chaos, since the output is highly sensitive on the initial conditions.
Now let us say you become obsessed with it, that you get some pencils and a ream of A4 paper and try to work out what are your chances of success, given parameters such as: plastic wrapper geometry, air pressure and temperature, height and angle of release, and trash bin diameter, just to name a few. I do not mean to discourage you, but even if you do find the governing equations, they would be so dependent on those parameters that even the most minute fluctuation in them might mean the difference between failing and succeeding, as is common in chaotic systems.
If you are still undaunted by the task, there is another approach, less analytical yet more useful, I would say. Instead of calculating the exact chances of success, you could repeat dropping it many times and keep track of the results (in this case, landing coordinates). With this log, you find a probability distribution of results that will enable you to state things like “in 15% of the trials, the candy wrapper landed between 5 and 10cm away from the bin’s center”.
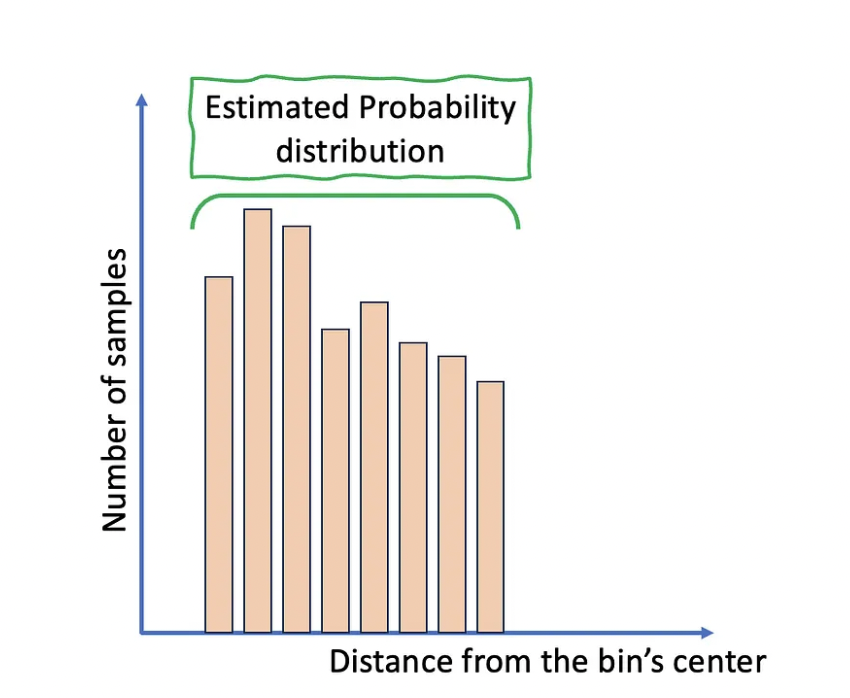
By repeating the process many times, the results should approximate the actual probability distribution of landing coordinates (for a determined set of parameters, such as the ones mentioned above). This is an example of a Monte Carlo method, a strategy to provide approximate results for possibly deterministic (and often prohibitively complex) processes. Its applications are ubiquitous, from physical simulations, like the relatable plastic wrapper projectile study, to predicting the behavior of financial markets.
As for its appellation, Monte Carlo is a code name suggested by a colleague of the physicists John von Neumann and Stanislaw Ulam, who are among its earliest users and whose work on nuclear weapons required secrecy. The name Monte Carlo itself refers to a casino in Monaco, where Ulam’s uncle would gamble away the money borrowed from his relatives. Indeed, a casino reference is simple yet effective to illustrate the method’s randomized nature.
Before jumping into the method itself, I must be perfectly honest with you, this article is a bit more technical than my previous ones, so let me start by a summary, which can be read independently from the rest of the article:
Monte Carlo methods consist of approximating the outcome of a complex process by repeating that process many times (each time resulting in a sample) and obtaining probability distributions. With enough samples, we can approximate the results statistically via the probability distribution of the collected samples. For example, instead of calculating how many grains of rice fit in a handful, you would ask a single person to get many handfuls of rice repeatedly and average the results to get a good guess. The actual calculation would be extremely complex, I suppose, given it could depend even on the hand’s smallest details. Many Monte Carlo implementations are variations of this simple case.
The idea is simple: the more repetitions, the closer the estimate is from the actual result. This closeness is quantified by the error ε. In classical Monte Carlo methods, this error scales with 1/√N, where N is the number of repetitions. This scaling means the rate of decrease of errors, for very large N, has a 1/√N slope (up to a constant multiplicative factor).
It turns out there is a quantum-enhanced version of Monte Carlo whose error scales with 1/N, where N is the number of applications of a certain quantum operator. This scaling represents a quadratic speedup of quantum Monte Carlo with respect to its classical counterpart.
Such quantum-enhanced Monte Carlo is based on the Quantum Amplitude Estimation Algorithm (QAEA), which is a mix of Grover’s quantum amplitude amplification and quantum phase estimation algorithms, hence the name. Current quantum computers are not suited for their implementation, but efforts are being made to simplify some of their subroutines, such as variational versions of the quantum phase estimation algorithm.
I hope I did not lose you until here and that you would like to know more about quantum-enhanced Monte Carlo. In that case, it would be nice to be comfortable with the fundamentals of quantum mechanics, quantum circuits, and perhaps routines such as quantum Fourier transforms (QFTs) — you can read more about it in this article written by my colleague Dr. Hamza Jaffali.
Regarding the underlying algorithm, you can find excellent QAEA tutorials in qiskit for example, but its connection with Monte Carlo methods is restricted to more academic sources, like research papers such as this one. Accordingly, the goal for this article is piecing the QAEA together and showing how it can be used in Monte Carlo-like problems. We start by a very simple example in quantum mechanics.
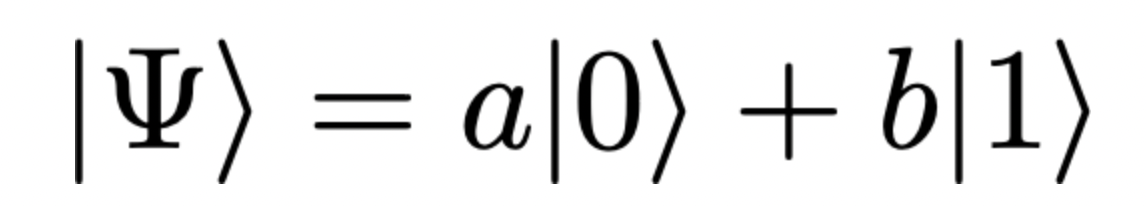
Above, the coefficients enable us to calculate |a|² and |b|², which represent the probabilities of measuring |0⟩ and |1⟩, respectively. But if you only have access to the full state |Ψ⟩, measuring the complex amplitudes a and b, as opposed to their absolute values, is not straightforward. The best you can do is use the Hadamard test, a procedure I described and implemented in a previous article. But here we will consider the simpler case of a state with real coefficients:
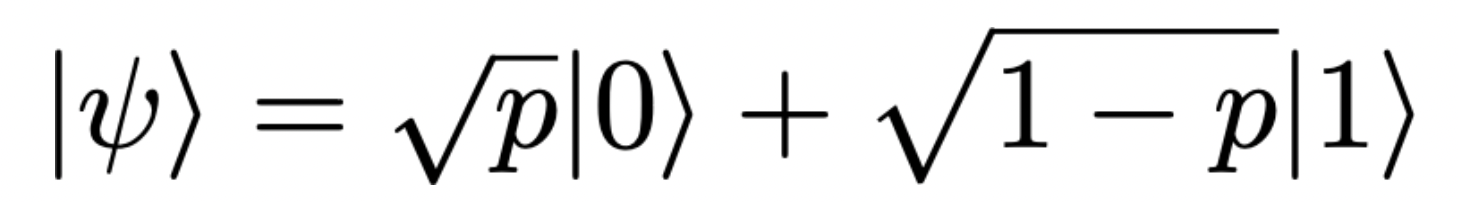
If the goal is estimating p, which is the probability of measuring |0⟩, the classical strategy is measuring the state |ψ⟩ many times, say, N. The probability p is estimated as:
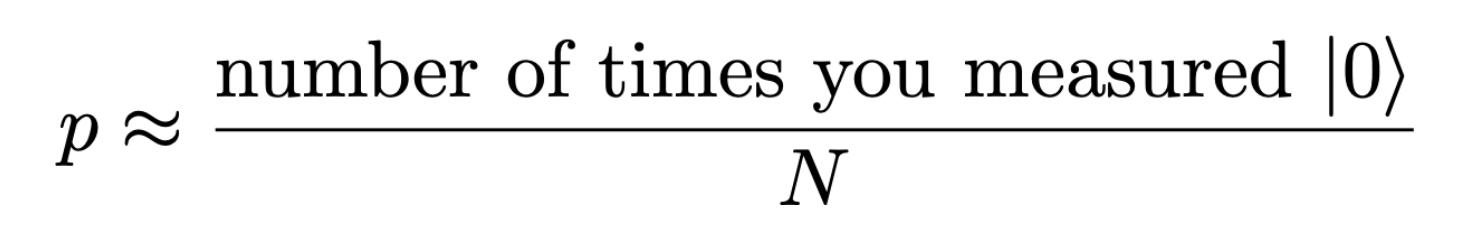
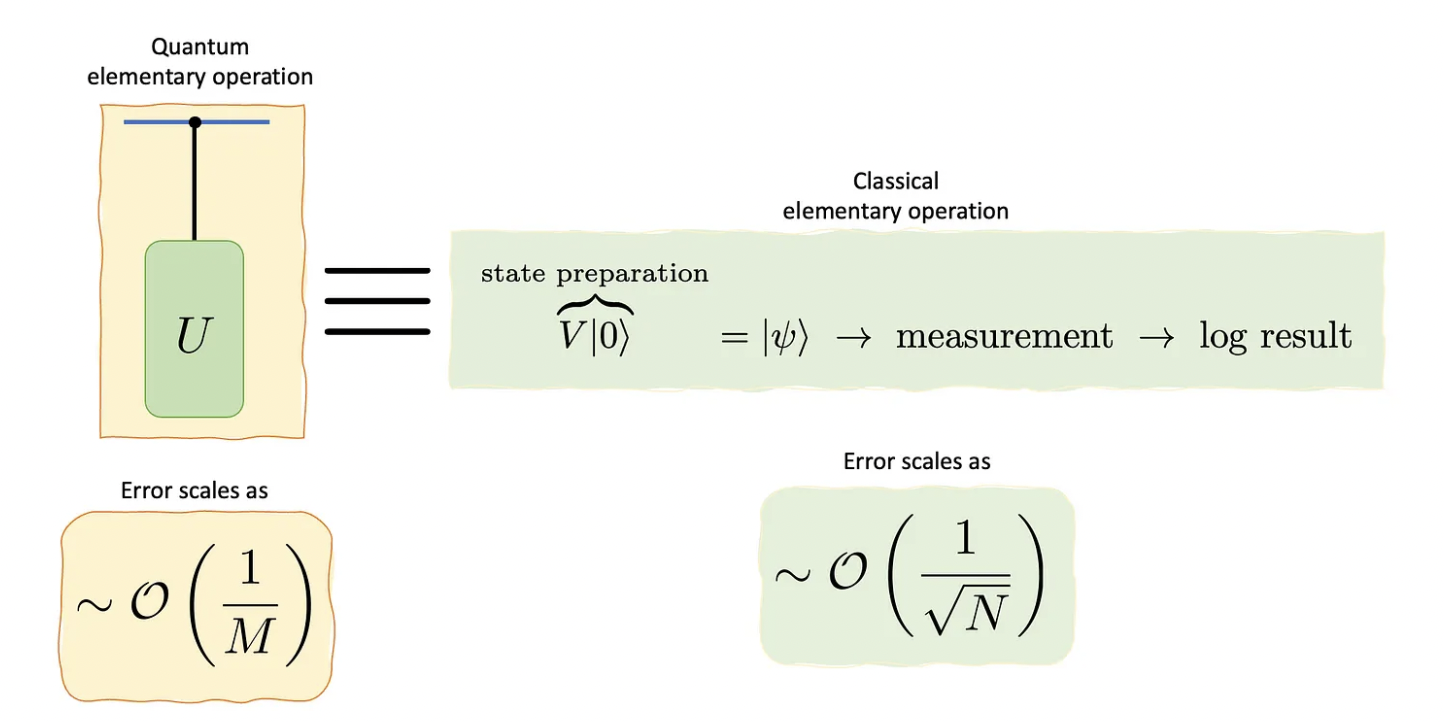
with the error scaling as 1/√N, for large enough N. The fundamental point in this process is that each sample requires a single state preparation and a measurement. A set of these constitutes a single sampling step, providing a sample. In the quantum-enhanced case, the definition of what counts as a “step” or a “repetition” is not as evident (at least it was not for me at first), but I hope to clarify it.
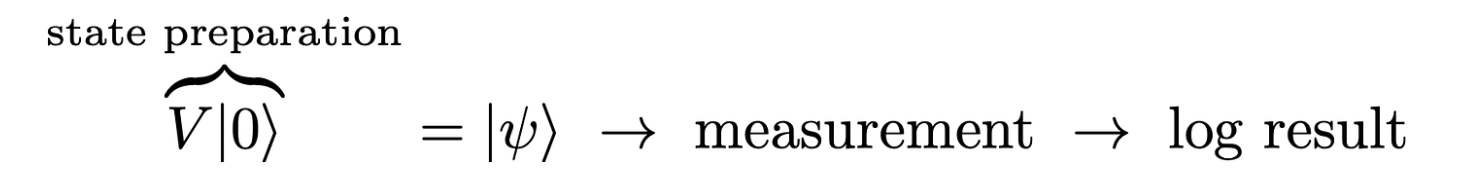
For comparison, let us apply the quantum-enhanced Monte Carlo to obtain an estimate for the probability p. We start by assuming, as before, the quantum state is initialized in the |0⟩ state, then rotated into the general state via a unitary V. The next step is building another unitary U that has |ψ⟩ as one of its eigenvectors, whose eigenvalue, a complex phase, contains an estimate of the probability p, as shown below.
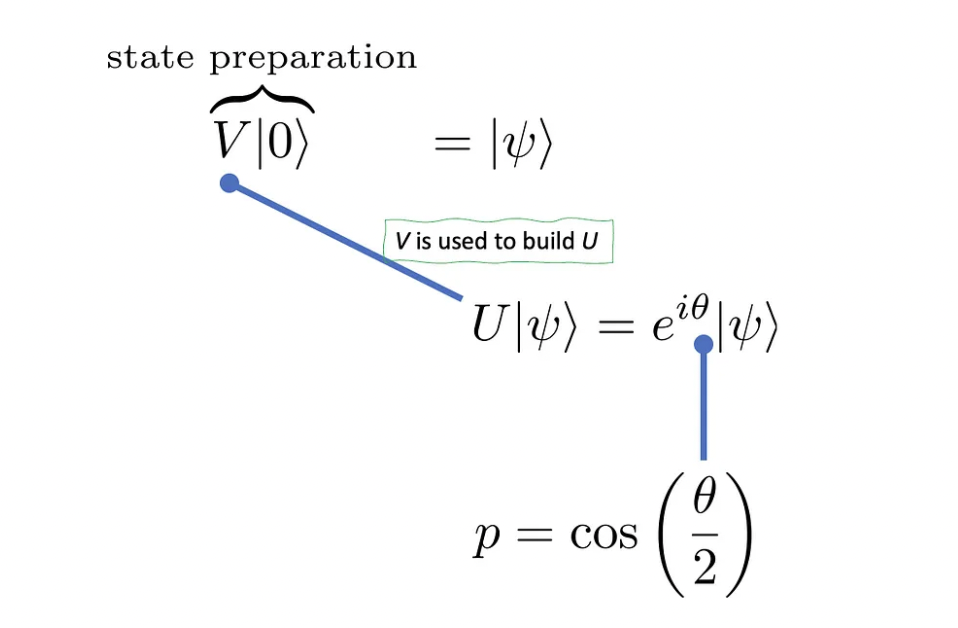
Building the unitary U requires ideas that are fundamental to Grover’s algorithm and I should write an article about it soon, as it involves some neat tricks that are nice to visualize in the Bloch’s sphere. For now, just assume it exists and that it acts as shown in the figure above. The next step in estimating the phase θ, which is equivalent to estimating p.
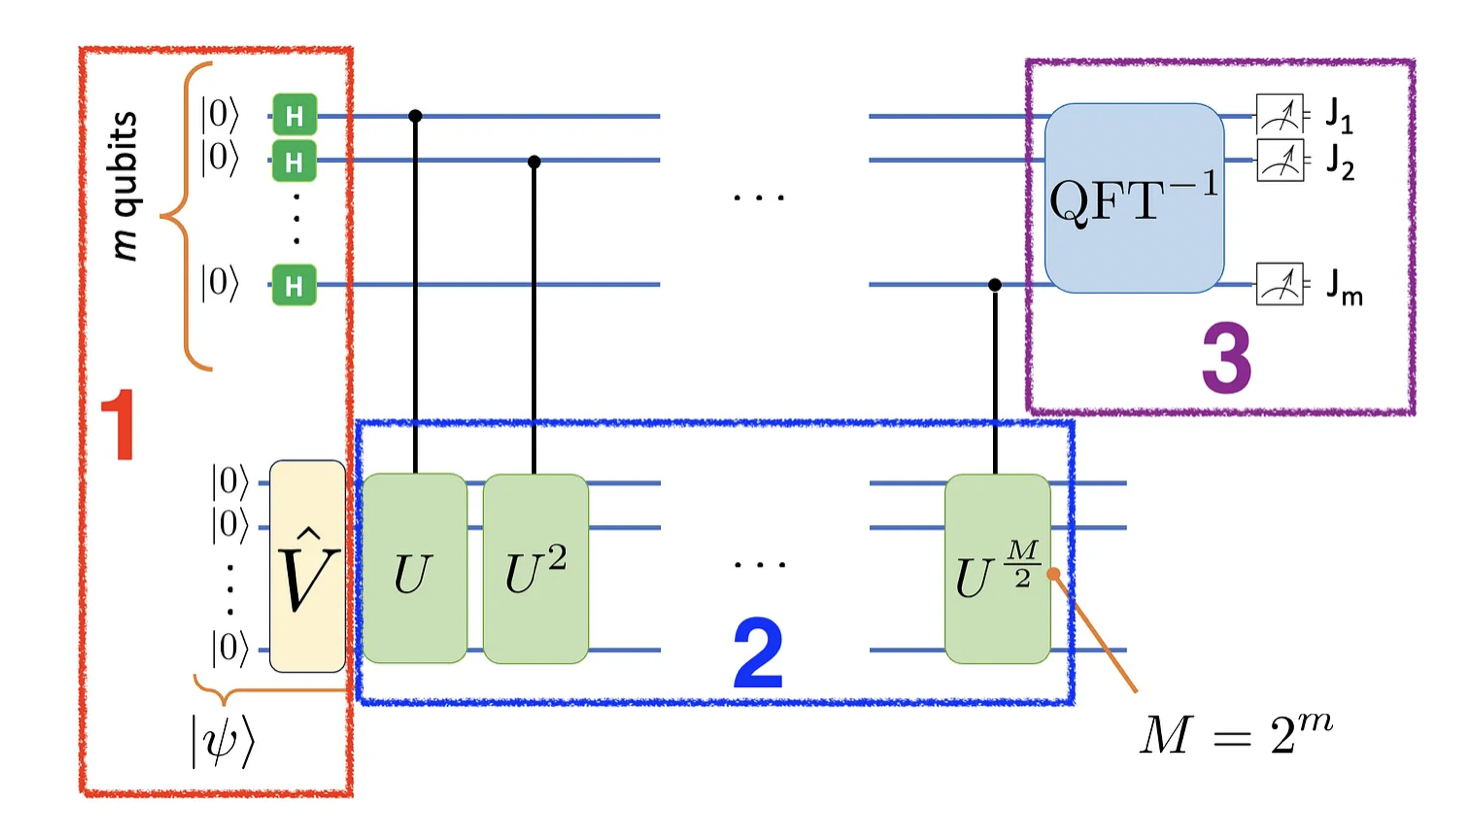
If you have seen the quantum phase estimation algorithm before, you can guess what comes next. Given the relationship between the complex phase angle and the probability p, if we manage to estimate the former, you can obtain the latter. I will avoid explaining how the quantum circuit works in detail, and will focus instead on the inputs and outputs of the algorithm blocks. Here is how the quantum circuit looks:
If you think this is just a phase estimation algorithm, you are absolutely right. But in case you are not familiar with it, fear not! I will go over each block. Are you ready?
In block 1, we prepare both the ancilla register of m qubits (which in the end will record the θ estimate in binary fractions), and the state |ψ⟩ itself. For that we need the operator V and m Hadamard gates.
Next, in block 2, we apply successive controlled-U gates, with the control gates cascading down the ancilla register. In total, we need M-1 controlled-U operations, with M = 2ᵐ. Notice that |ψ⟩ is an eigenstate of U, so these operations do not fundamentally change it, just multiply it by a global complex phase.
Finally, in block 3, we measure the ancilla register to obtain a string of 0s and 1s, labeled as J₁J₂ … Jₘ. They enable us to estimate the angle θ via binary fractions: θ = 2π(0.J₁J₂ … Jₘ). Here is how to read it:
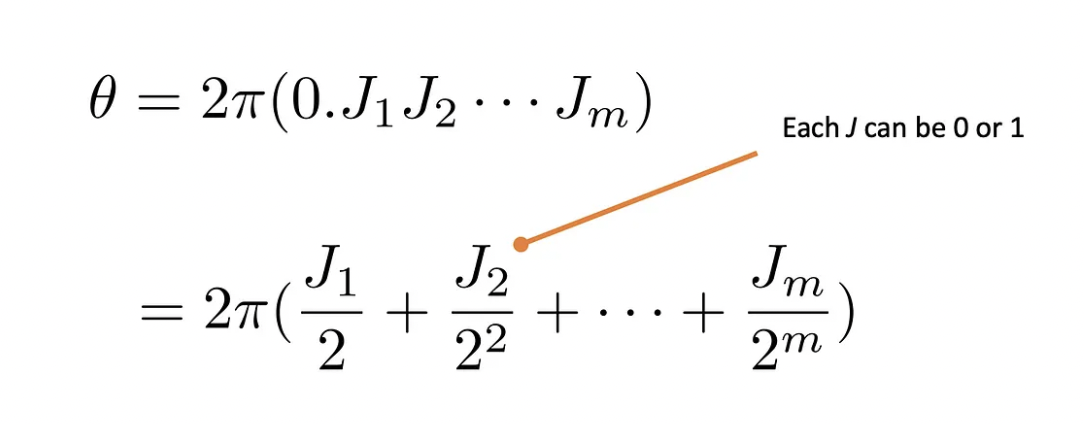
We now have all the main elements of the algorithm and are in position to discuss it. We can start by what counts as a “fundamental step”, and we should take a closer look at the binary fraction above. You would agree that the number of ancilla qubits (m in total) determines the smallest correction to the phase θ, given the binary fraction displayed above. Indeed, each of them increments the precision by a factor of 1/2, so that if your quantum register has m ancillary qubits, your estimate can be around 1/2ᵐ off the exact value, as it represents the smallest contribution.
In other words, the error ε is of about 1/M (with M = 2ᵐ ), that is, it scales as 1/M. Furthermore, because the ensemble of controlled-U blocks is made of M-1 applications of U, we will consider the controlled-U operations as the fundamental steps.
Since the estimation error scales with 1/M, with M being the “fundamental steps” in the algorithm, we say it represents a quadratic speedup with respect to the classical method (e.g., naive sampling), whose error scales as 1/√N.
There are more details in this story that will be left for a later article. One of them is the already-mentioned building of the operator U, another is that not all runs of the quantum algorithm provide the best estimate for the phase θ, which calls for multiple runs to provide better results. This, however, does not harm the quadratic speedup. Furthermore, we can generalize this method to evaluate more than just the probability of a single configuration. In principle, we could extend it to evaluating expectation values, for example.
For now, stay tuned! More will be disclosed soon 😎
At ColibrITD our goal is bringing Quantum Computing for All. We use the available universal quantum computers to obtain the most quantum advantage for our customers’ use cases. That includes studying algorithms that require fault-tolerant quantum computers, able to run, among others, quantum-enhanced Monte Carlo.

Discover the Latest Blog Posts
Experience FASTER and More Efficient Computing with Our Quantum Solution


